
1 July 2026
How to use Optoel Simulator
The current version of Optoel Simulator provides the tools to visualize and save both 2D and 3D mode field profiles in cylindrical optical fibers. The calculations handles user-defined refractive index profile and also the effects of bending the fiber.
Input data
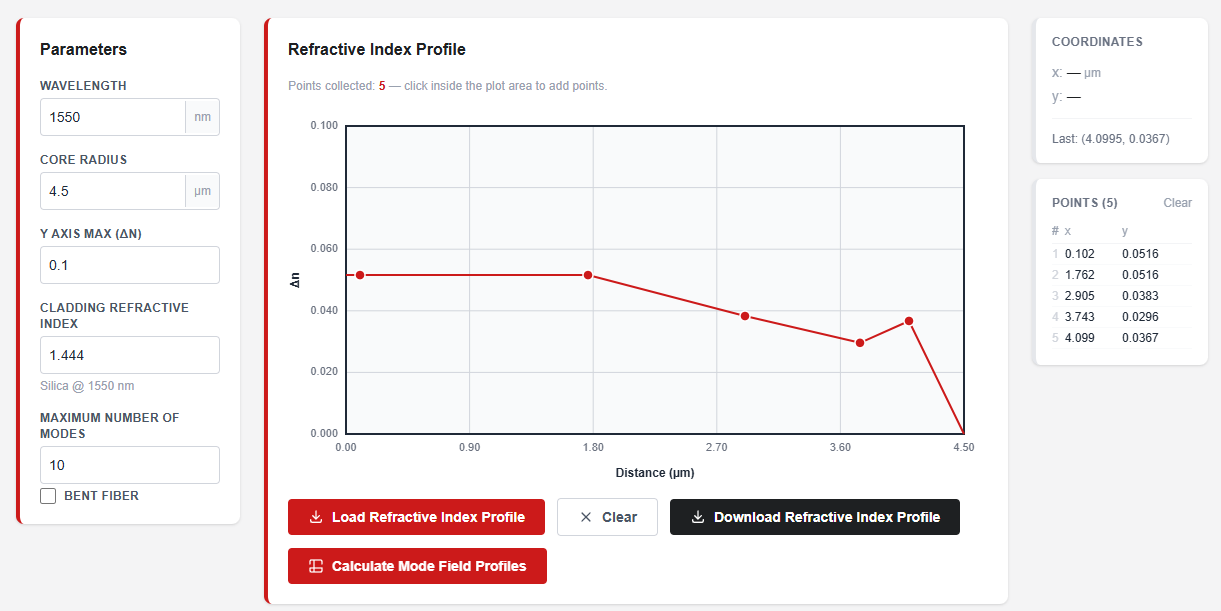
On the lefthand side the user input the parameters:
the calculation wavelength expressed in nm
the core radius expressed in um
the maximum index difference that can be defined in the Refractive Index Profile chart (delta n)
the absolute refractive index of the cladding
the maximum number of modes that can be calculated
when BENT FIBER check box is clicked the user can input the bending radius (in m) of the fiber
On the central part of the screen there is a chart where the user can define the refractive index profile within the limit specified by the parameters from the lefthand side:
The refractive index profile is defined as delta n (Y axis). That means that the absolute values will be calculated as the sum between the absolute cladding refractive index and the values from this chart.
The X axis represents the distance in um from the core center
By clicking inside the chart a new value is added to the core refractive index.
To delete a point: right click an existing point, then select DELETE.
Refractive index profiles can be loaded from json files by clicking Load Refractive Index Profile. The json file should contain a list of points in format x and n. Here is an example:
[
{
"x": 0,
"n": 1.4979
},
{
"x": 4.2124,
"n": 1.4979
},
{
"x": 4.5,
"n": 1.444
}
]
Note that the x values are in um and the n values are absolute refractive index values.
All the values from the chart can be removed by clicking Clear
The current refractive index profile presented in the chart can be downloaded by clicking Download Refractive Index Profile
The mode field profiles can be calculated and displayed by clicking Calculate Mode Field Profiles
On the righthand side the user can see:
the current position of the mouse pointer on the chart (x and n)
The list of the points set in the chart
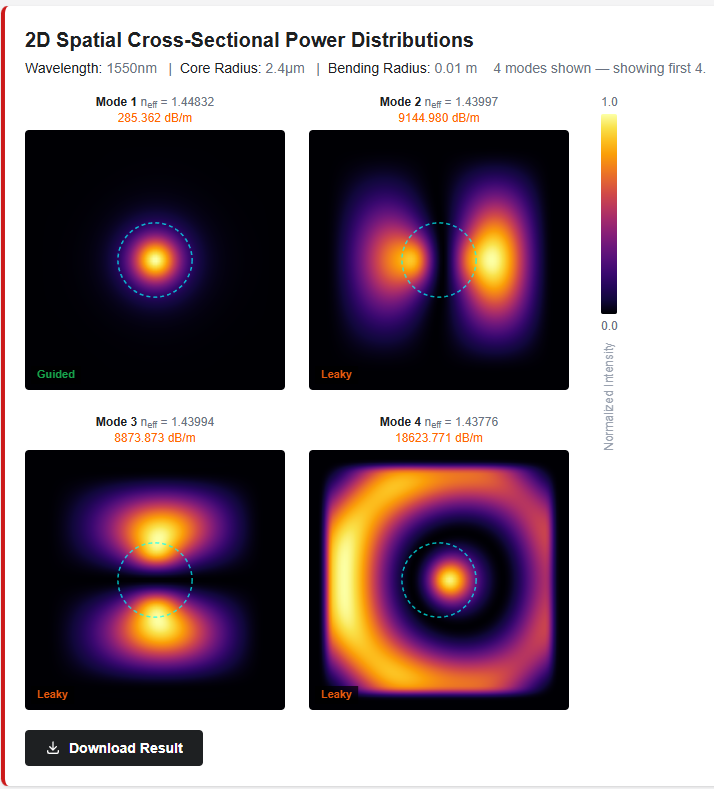
2D visualization of the mode field profiles
The mode field profiles are displayed as an array of 2D images. The modes are named using the LP convention. Each image includes the following information:
the effective refractive index
if the mode is guided or leacky
the bending losses (if the bending mode is selected)
The mode filed profiles can be downloaded as json file by clicking the Download button.
3D visualization of the mode field profiles
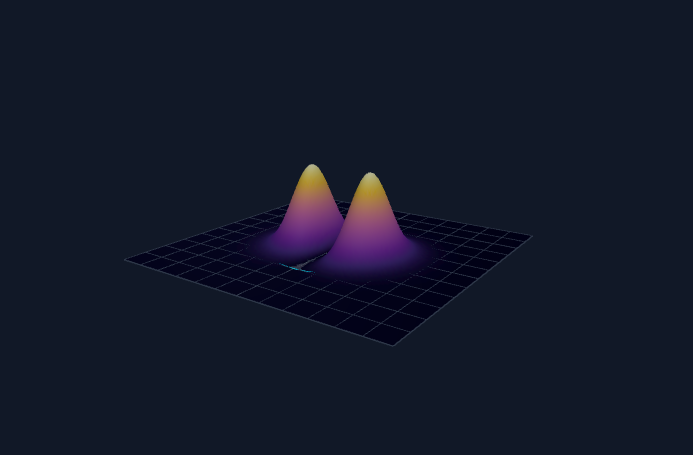
The mode filed profiles can be visualized as 3D images.
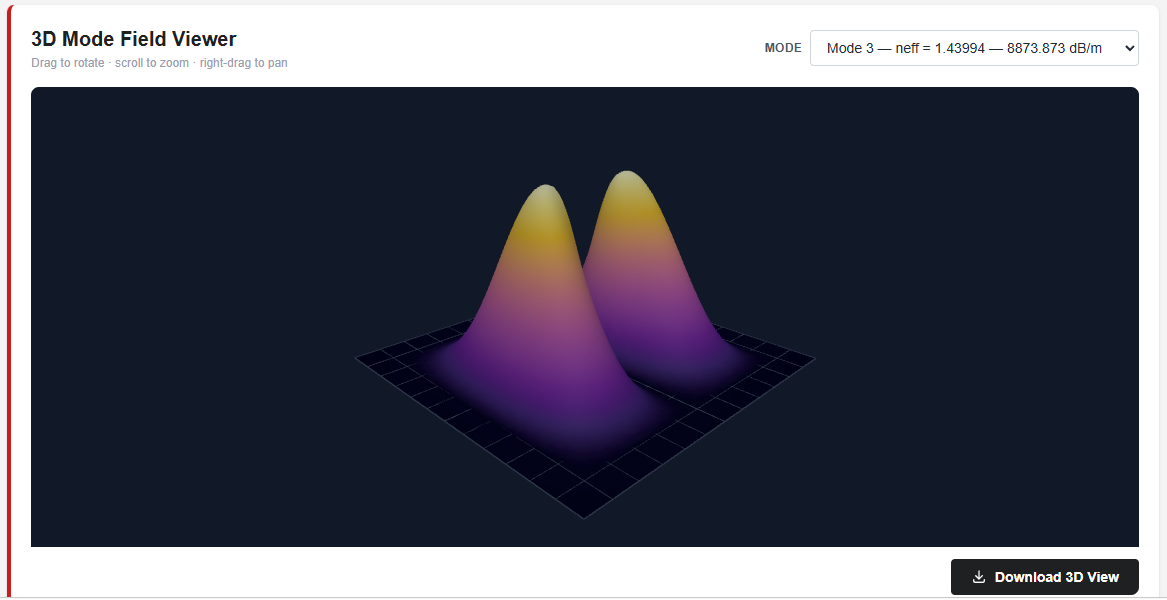
The image can be:
rotated - left mouse drag
scrolled - rotate the mouse central wheel
panned - right mouse drag
The displayed mode is selected using the dropdown box on the top right.
The image and the associated json can be downloaded using the button Download 3D View.
Comments (0)
No comments yet — be the first!